

SUMMARY
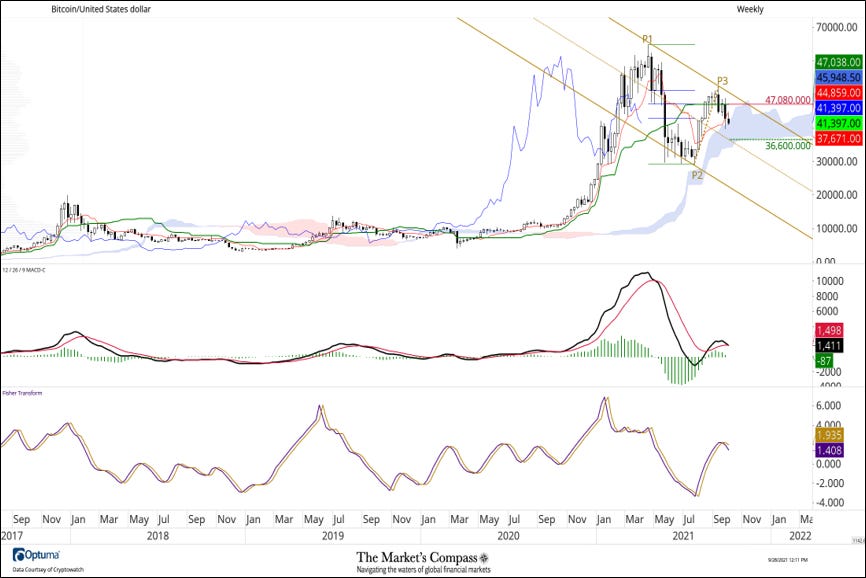
In September of last year, I posted the chart shown below to my Substack Blog. At that time the weight of the multi-time frame technical evidence suggested that Bitcoin was still in an ongoing correction
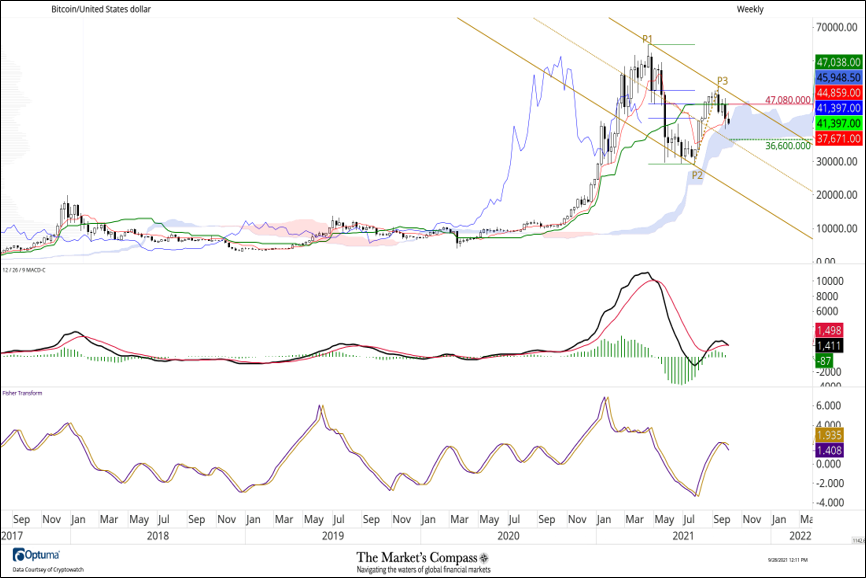
.Bitcoin / Weekly Chart
Although there was a 2-month countertrend rally early this year that drove prices higher from Median Line support near the…
Read more


